    #| warning: false
pacman::p_load(ggstatsplot,
tidyverse, PMCMRplus) Hands-on_Ex04
Exercise Objectives
ggstatsplot package to create visual graphics with rich statistical information,
performance package to visualise model diagnostics, and
parameters package to visualise model parameters
Basics about Visual Statistical Analysis with ggstatsplot
ggstatsplot is an extension of ggplot2 package for creating graphics with details from statistical tests included in the information-rich plots themselves.
To provide alternative statistical inference methods by default.
To follow best practices for statistical reporting. For all statistical tests reported in the plots, the default template abides by the APA gold standard for statistical reporting. For example, here are results from a robust t-test:

Plotting diagrams
ggstatsplot and tidyverse will be used for statistical plots
Read data here
exam <- read_csv("data/Exam_data.csv")Rows: 322 Columns: 7
── Column specification ────────────────────────────────────────────────────────
Delimiter: ","
chr (4): ID, CLASS, GENDER, RACE
dbl (3): ENGLISH, MATHS, SCIENCE
ℹ Use `spec()` to retrieve the full column specification for this data.
ℹ Specify the column types or set `show_col_types = FALSE` to quiet this message.One-sample test with: gghistostats() method
Default information: - statistical details - Bayes Factor - sample sizes - distribution summary
set.seed(1234)

gghistostats(
  data = exam,
  x = ENGLISH,
  type = "bayes",
  test.value = 60,
  xlab = "English scores"
)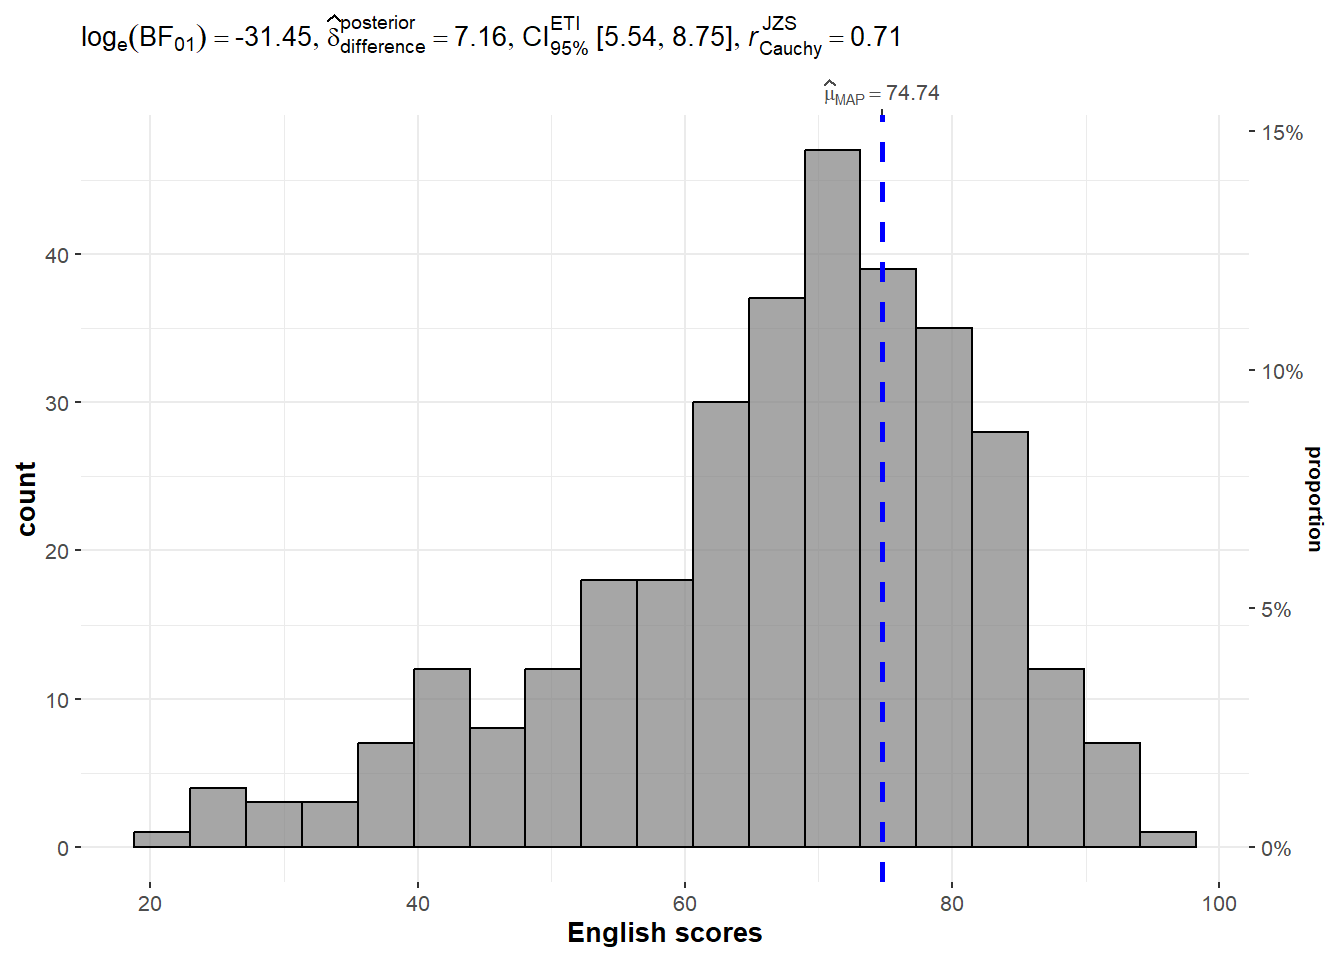
# We are looking at english, type using bayes factor,there are more types available.
# Test the hypothesis that the value equal to 60
# if we change type to "p", it become parametric test
About the Bayes Factor
A Bayes factor is the ratio of the likelihood of one particular hypothesis to the likelihood of another. It can be interpreted as a measure of the strength of evidence in favor of one theory among two competing theories.
That’s because the Bayes factor gives us a way to evaluate the data in favor of a null hypothesis, and to use external information to do so. It tells us what the weight of the evidence is in favor of a given hypothesis.
When we are comparing two hypotheses, H1 (the alternate hypothesis) and H0 (the null hypothesis), the Bayes Factor is often written as B10. It can be defined mathematically as

How to interpret Bayes Factor
A Bayes Factor can be any positive number. Most common interpretation:

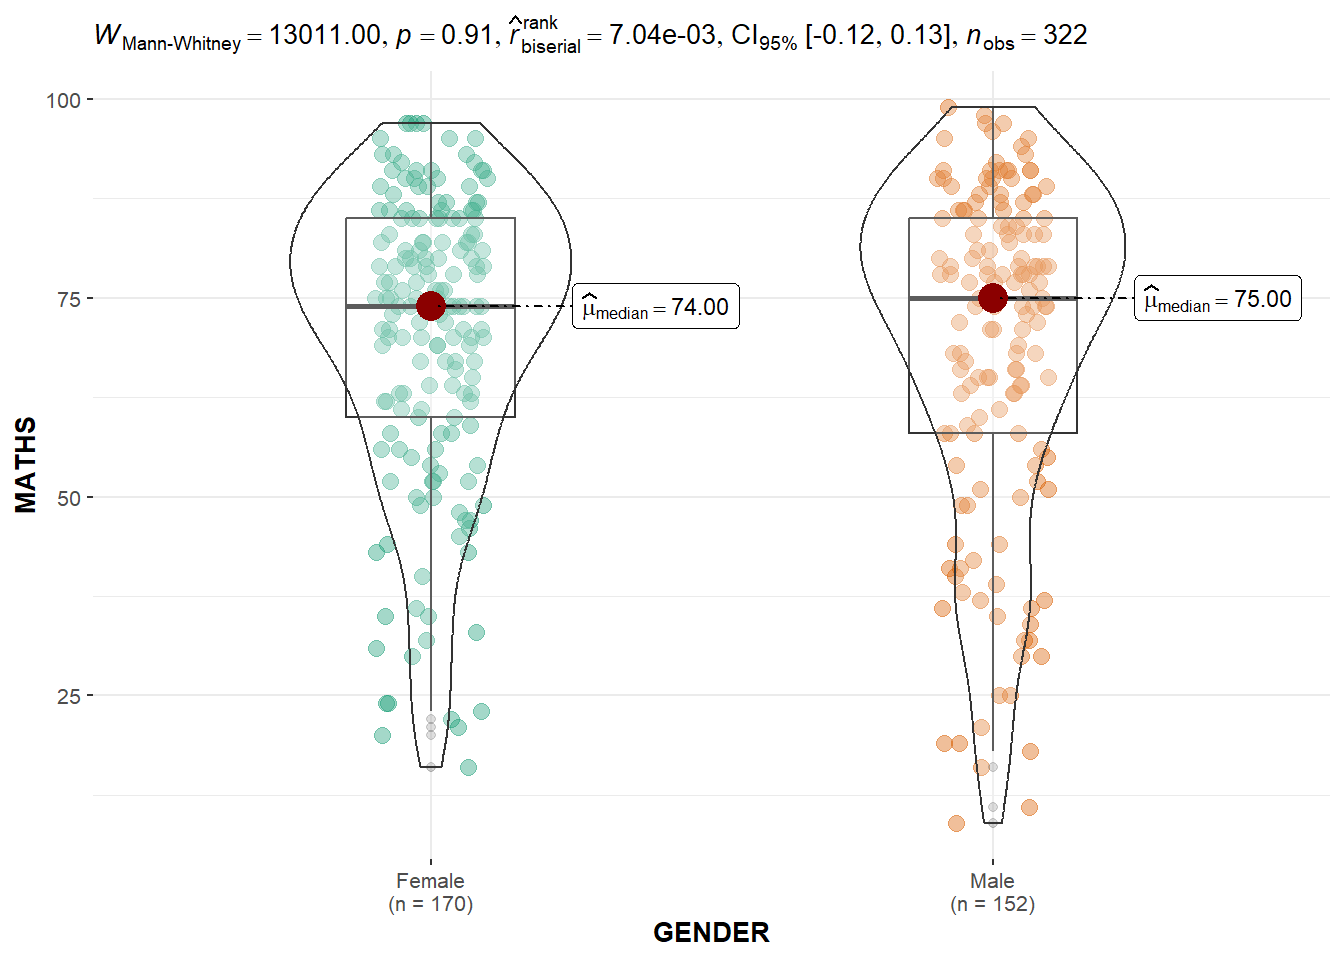
Two-sample mean test: ggbetweenstats()
ggbetweenstats() is used to build a visual for two-sample mean test of Maths scores by gender.
   #| warning: false
  ggbetweenstats(
    data = exam,
    x = GENDER,
    y = MATHS,
    type = "np",
    messages = FALSE
  )
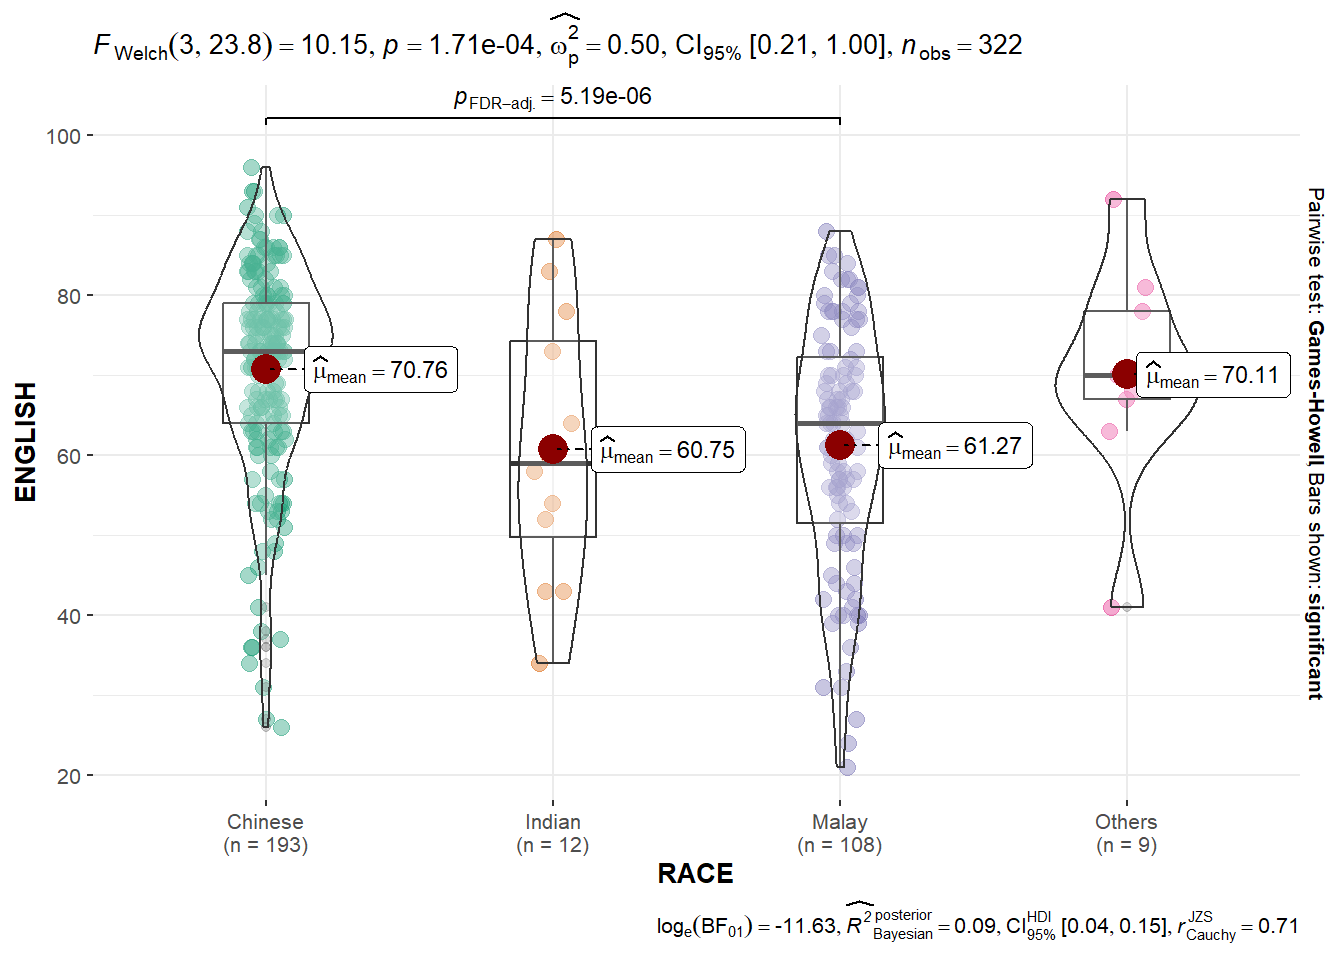
Oneway ANOVA Test: ggbetweenstats() method
ggbetweenstats() is used to build a visual for One-way ANOVA test on English score by race
   #| warning: false
   # “ns” → only non-significant
   # “s” → only significant
   # “all” → everything

  ggbetweenstats(
    data = exam,
    x = RACE,
    y = ENGLISH,
    type = "p",
    mean.ci = TRUE,
    pairwise.comparisons = TRUE,
    pairwise.display = "s",
    p.adjust.method = "fdr",
    messages = FALSE
  )
When to use what statistics? ggbetweenstats - Summary of tests


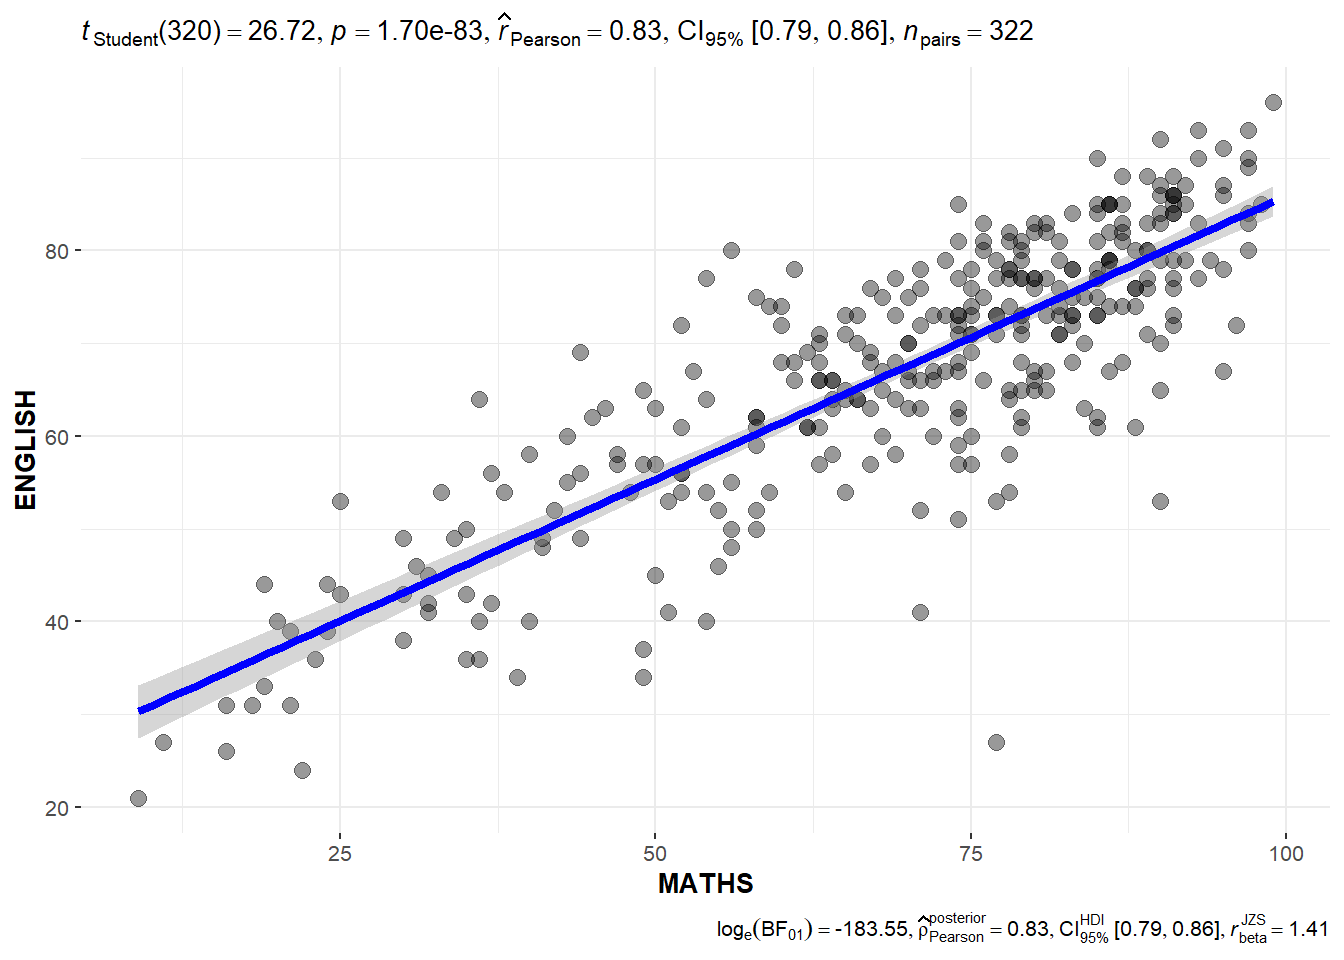
Significant Test of Correlation: ggscatterstats()
ggscatterstats() is used to build a visual for Significant Test of Correlation between Maths scores and English scores.
  ggscatterstats(
  data = exam,
  x = MATHS,
  y = ENGLISH,
  marginal = FALSE,
  )
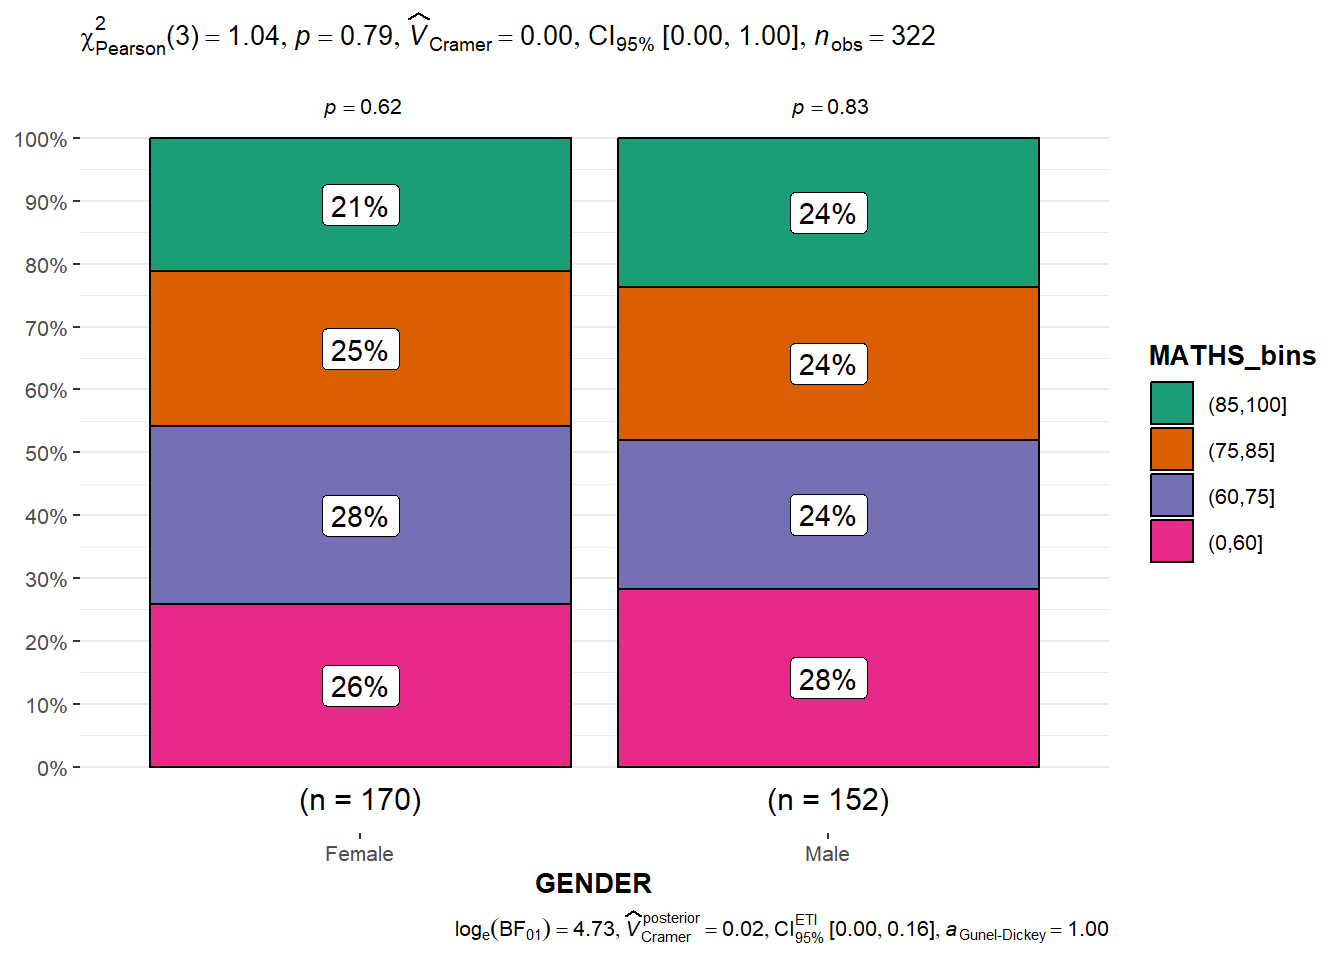
Significant Test of Association (Depedence) : ggbarstats() methods
the Maths scores is binned into a 4-class variable by using cut(). then ggbarstats() is used to build a visual for Significant Test of Association
  exam1 <- exam %>%
  mutate(MATHS_bins =
           cut(MATHS,
               breaks = c(0,60,75,85,100))
  )
   ggbarstats(exam1,
     x = MATHS_bins,
     y = GENDER)